Address
10 Street Name, City Name
Country, Zip Code
Get in touch
970-461-1348
inside.sales@mdsusa.net
Follow us
Surge Testing
Education & Training @ Motor Diagnostic Systems
Overview
Surge testing is a technique to test the dielectric strength of the insulation in windings. These windings can be solenoids, toroids, transformers, or some other type of winding like those found in electric motors. The technique involves applying a fast rise time current pulse to the winding which induces a turn to turn voltage between adjacent loops of wire. If that induced voltage is high enough to overcome weak insulation, an arc will be formed between the wires. This arc is picked up by the surge test equipment and displayed for the operator.
Before moving on with more applications, the technique will be explained in some detail. Again, surge involves applying a fast rise time current pulse to the winding or coil. Looking at the basic equation for voltage across a coil (below), the voltage across the terminals of the coil is proportional to the time rate of change of the current. The inductance of the coil is the proportionality constant.

(where L = inductance, i is the current and t is time. The term di/dt is the time rate of change of current).
Simply said, apply a pulse to a winding, and there will be a voltage across the terminals. In surge testing, we always measure
the voltage instead of the current – the reason being to not exceed some breakdown voltage of some other insulation in the
winding.
The induced voltage from a current pulse (which is observed at the terminals of the winding) is actually distributed across all
the turns in the winding. For example, if the winding is 100 turns and the observed terminal voltage is 1000Volts, the
voltage between turns is 10 volts….in a simple world.

In reality, the voltage distribution will not be even distributed as shown above. More on this later.
If the voltage is high enough across damaged turn insulation in the coil, then an arc will form. From Paschen’s minimum
breakdown principle, the voltage across the turns must be above 375V and the coils close enough to each other for an arc to form. When this arc occurs, the shape of the surge waveform changes as will be discussed later on.
What Is Turn Insulation?
Turn insulation is that insulating material that separates loops of wire in a winding. The illustration below shows the
different types of insulation found in the cross section of a form wound coil. In the illustration the turn insulation consists of
1. the enamel coating on the wire conductor itself – this is the primary turn insulation,
2. a wrap of more insulation around the enamel (labeled Strand Insulation in the illustration) – this is supplemental turn
insulation,
3. and another wrap of insulation around the bundle of conductors that forms the “coil conductor” – this insulation
isolates individual form wound coils from each other and also isolates the form wound coil from the steel core – this
is the total Turn Insulation in the illustration

In this example, 4 square conductors are in parallel to get
the ampacity of the coil required for the design. These 4
conductors are often called “four in hand”. When
terminated at the end of the coil, all 4 conductors are
terminated together at the same point by soldering or
brazing them together.
The turn insulation found in random wound coils is the
enamel film on the wire itself.

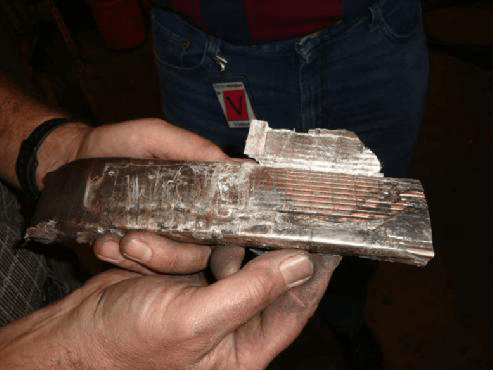
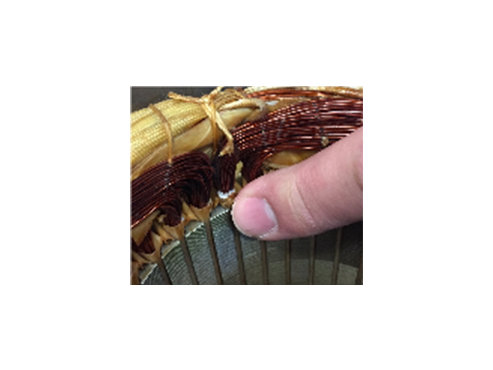
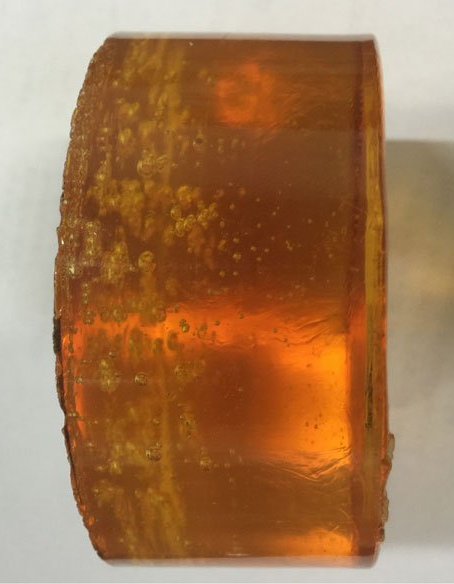
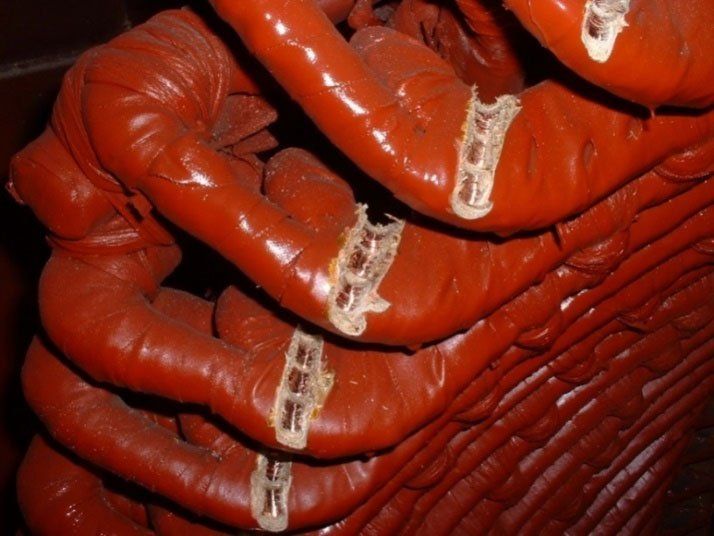
At the end of the day, the surge test is looking to identify any turn insulation that is damaged or burned. An example of
damaged insulation is shown in the three photos below.
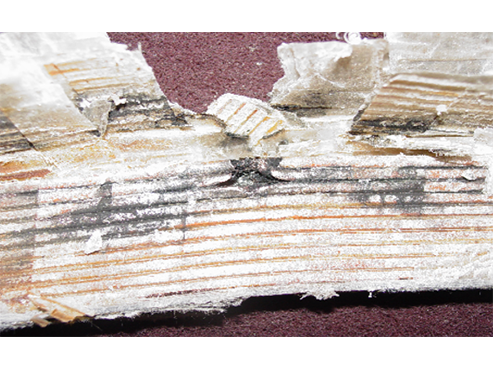
The third photo below also shows where the resin did not fully soak the form wound conductors of the coil. Eventually, the
turn insulation completely failed, allowing two adjacent windings to make a “welded fault”.
What Makes the Surge Pulse?
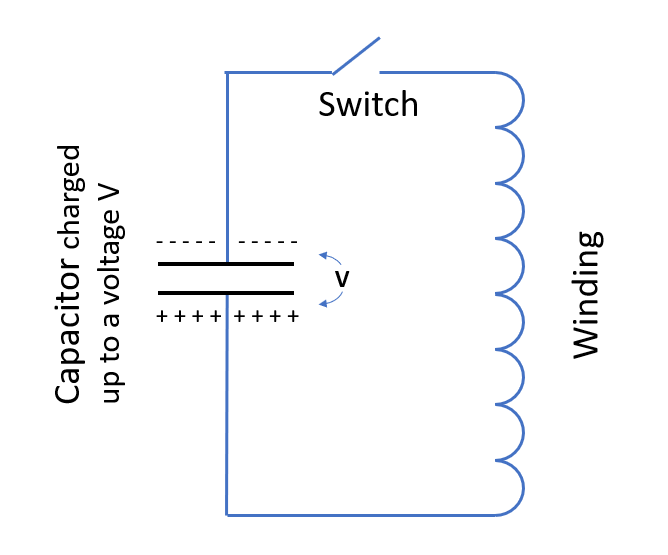
A good question to ask is what makes the impulse that is applied to the winding? The answer is a capacitor is charged up to
a high voltage and then switched onto the coils of the winding – see illustration below. When the switch closes, the charge
stored on the capacitor flows into the windings of the motor. The flow of current goes from zero amps to the peak amps
which gives the high rate of change of current – the di/dt – that creates a back EMF / Voltage. When multiplied by the coil
inductance, this di/dt gives us the voltage across the coil.
When the switch closes, the voltage across the coil will be an oscillating sine wave shown below.
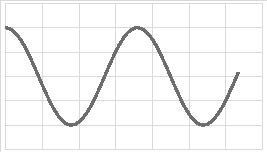
In a perfect lossless world, this sinusoid would run on forever and go off the right side of this page (and across the room, out
the door and across the street.) In reality, there is some resistance in conductors of the coil, some losses in the steel core, and some resistance built into the surge tester itself. The result is a decaying sine wave – see below – instead of a continuous ringing sine wave shown above.
To summarize how the surge tester works:
- a capacitor is charged up inside the tester and
- then switched onto the winding,
- the voltage across the winding is measured and graphed on the screen of the tester.
The figure below places both the voltage and current waveforms together on the same plot. Note: it is that small point on the
current graph where the current goes from zero to some value that causes the resulting induced voltage / back EMF on the
winding. In nearly all surge test equipment in the market only shows voltage. However, the real active agent is the current.
Instead of looking at simple illustrations, below is screen capture of a surge test made between two terminals of a three-phase
motor winding.
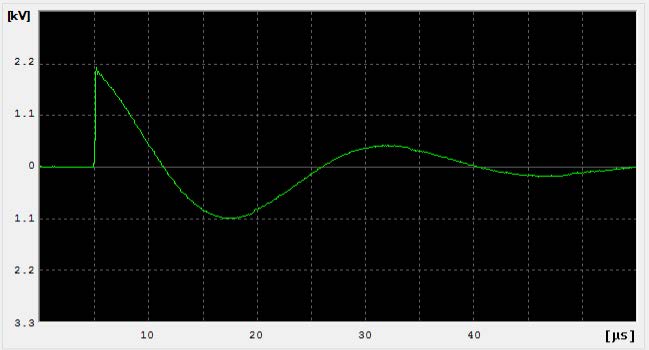
Here, the voltage rise from zero to about 2100V and then the voltage “rings out” about 2 cycles before dropping back to
zero. This whole ringing process takes about 50 microseconds – a very short amount of time.
The initial rise of the voltage is an important parameter. The faster the rise time of voltage means there will be a higher turn-turn
voltage, which is the goal of surge testing. The rise time in the above screen capture is about 150 nano seconds (150ns).
If a slower pulse is applied to the winding, say one with a rise time of 1000ns, a much lower voltage will be induced across
the winding terminals. So, one of the key features of a surge tester is the high speed switch. Typical switching times are
100ns to 400ns. This rise time value is a parameter that is specified in the standards (IEEE, IEC, etc.). More on standards
later.
Error Area Ratio
Before going on to describe more details of the different types of surge testing, the Error Area Ratio algorithm must be
explained. Consider two waveforms F1(i) and F2(i). The EAR formula is
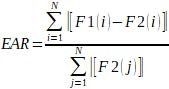
What this formula really does is sum up the area between the two waveforms (the numerator) and divides it by the area of
just one of the waveforms. Graphically, the formula comes down to the illustrations below. “A3” is the area between the two
waveforms:
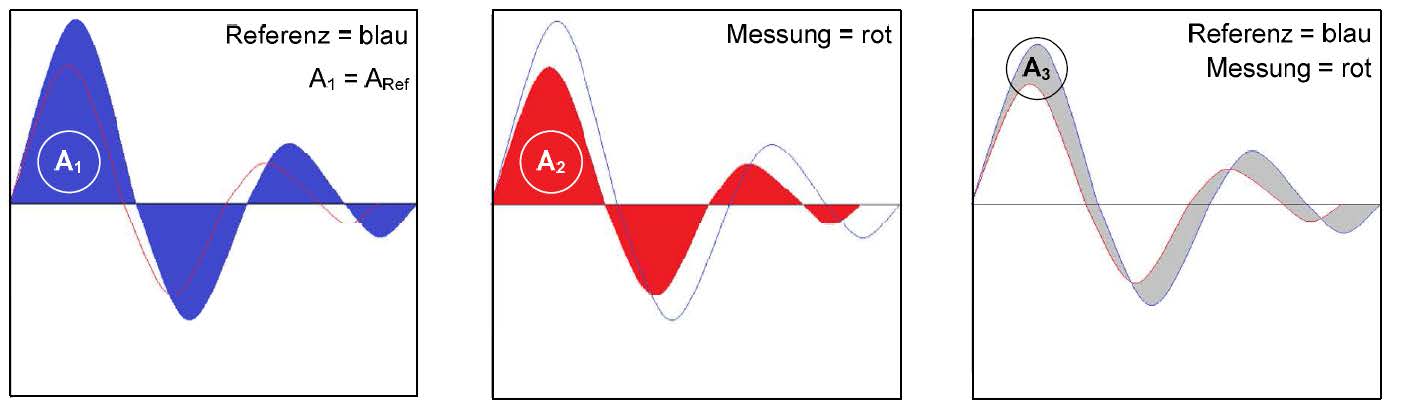
“A2” is the area under the second waveform.
So, the EAR number is the ratio of the two areas A3/A2 or the area of the gray area divided by the red area:

The EAR algorithm is used in both comparison testing and turn-turn testing. In comparison testing, the two waveforms
being compared are run through the EAR calculation to get a number that represents the difference in shape of the two
waveforms. If two waveforms are identical, the EAR calculation gives a “zero”. If there is a slight difference, a difference
that you can barely see, the EAR gives ~4%. If there is a really noticeable difference, the EAR will be +10% or greater.
Types of Surge Testing
There are three ways the surge test is used to test a winding:
- Comparison Testing
- Turn-Turn Arc Detection
- Partial Discharge Testing
Comparison Testing
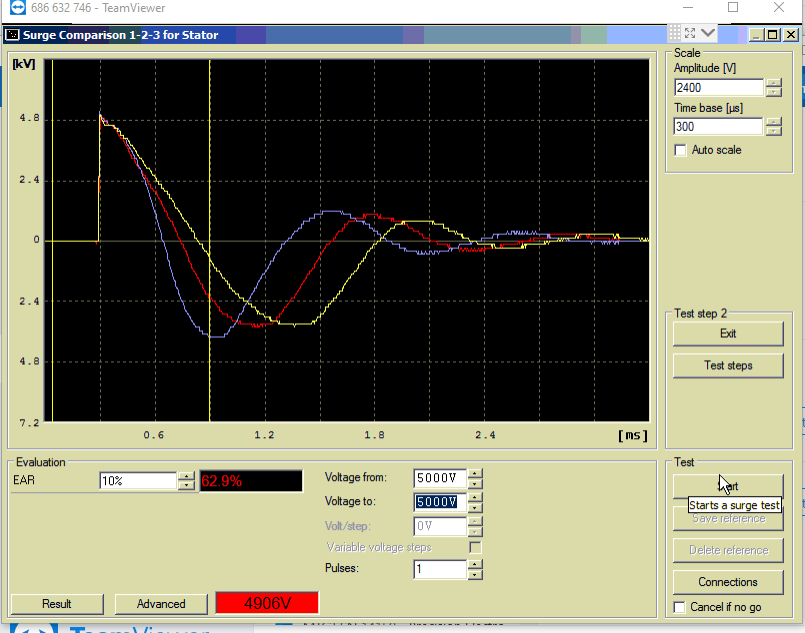
Comparison testing is performed by comparing a surge waveform to some reference waveform. That reference waveform can be from a known good coil, identical winding or another winding in the same device like those found in a three phase motor or transformer. An example of comparison testing of a three phase stator is shown in the screen capture below. Here the reference waveform is the first of the three waveforms found by testing between lead 1 and lead 2 (phase A to phase B). The waveform obtained by performing the exact same test between lead 2 and lead 3 (phase B to phase C) is compared to the first waveform. Likewise, the lead 3 to lead 1 test (phase C to phase A) waveform is also compared to the first waveform.
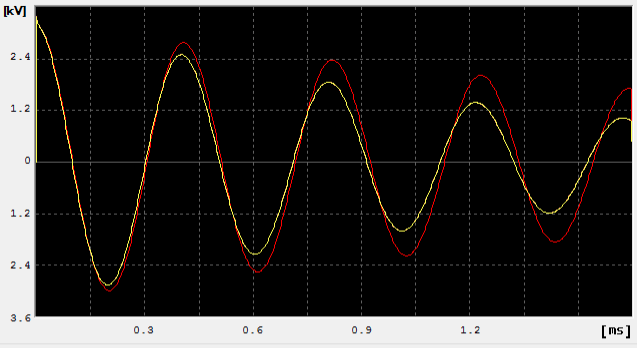
In the comparison test above, there really are three waveforms present, but two are on top of each other (two waveforms under the yellow trace). Clearly, these two waveforms are very similar and “compare well”. The third waveform is significantly different than the other two. So, this waveform does not compare very well.
The reason for this situation is the stator is concentric wound where two of the three windings are physically smaller than the third winding. Concentric windings are often made with the last winding inserted into the core being slightly larger in size so its end turns can be wrapped over the previously inserted coils. This overlap allows the last winding to clear the rotor.
If the winding was a lap type winding, then all three waveforms should lie on top of each other.
This fact is why surge comparison testing is so successful. However, it must be understood that only windings like lap wound three phase stators can be successfully compared to each other. If there is some difference in the windings, such as different coils sizes or a different core surroundings, a good reliable comparison cannot be made.
The big idea behind comparison testing is to use a reference waveform to identify another coil that has compromised insulation is not properly made.
Turn-Turn Arc Detection
Turn-turn arc detection is an application of the surge test where the test voltage starts at a low value, say line voltage, and is smoothly increased up to the maximum voltage for the winding.
Example, for a new 480V three phase motor, the test starts at 500V and goes up to 3300V in approximately 25 volt increase in test voltage for each applied surge.
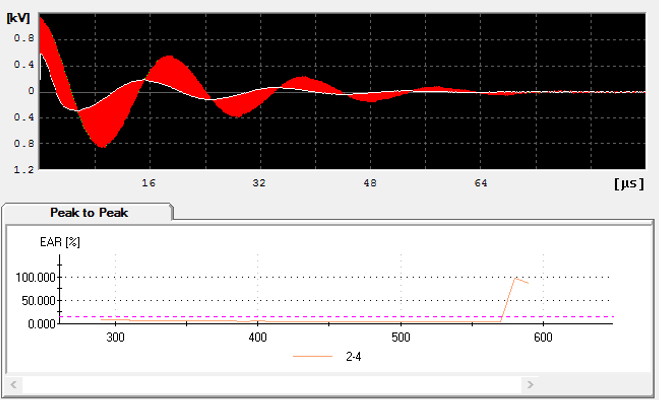
If the test voltage reaches a value where damaged turn insulation allows an arc to form between adjacent loops in the coil, then the waveform at the higher voltage will shift to the left compared to the previous lower test voltage waveform.
The screen capture above shows an arcing turn to turn fault at about 1000V. In this example, the surge test voltage was slowly increased until a voltage was reached that caused an arcing fault in the winding. When this fault occurred, the waveform shifted to the left. The difference in area between the arching waveform and the previous “good” waveform is shown in red which makes it easy for us to see by eye. Of course, the computer can give this red area a number which can be used to qualitatively tell how much the waveform changed shape.
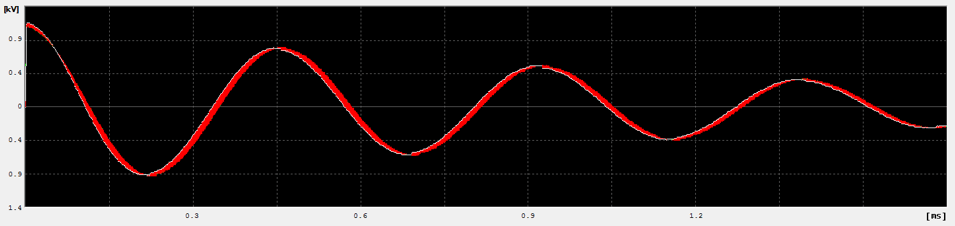
The screen capture above shows another example where the shift is present, but not as significant as the previous example. None the less, the surge test can clearly display the waveform shift and give us a quantifiable number for the differences.
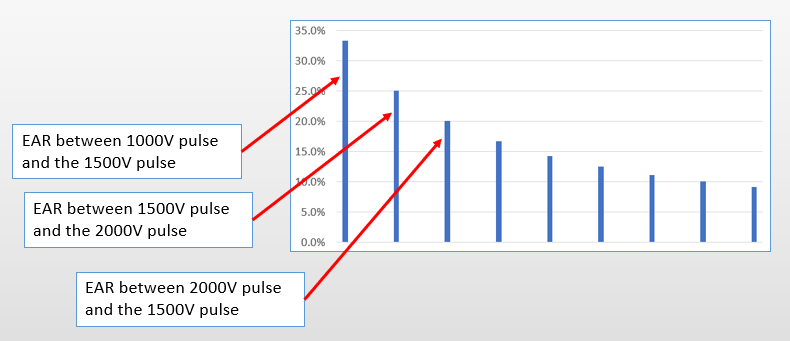
The commercial terms for this type of test are “Peak to Peak EAR” or “Pulse to Pulse EAR”. The abbreviation for both these terms is “ppEAR”. The technique involves starting to surge test at a low voltage, say at the operating voltage for the winding, and then increasing the test voltages in even steps until the final test voltage for the winding is reached. An illustration of the technique is shown below. Here, all of the waveforms are shown on the same graph. You can see the test starts at 1000V for the first waveform, then increases by 500V for the waveform at 1500V, increases again by 500V for the 2000V waveform, increase again by 500V for the 2500V waveform, etc. This method of looking at successive pulses is why the test is sometimes called the “pulse to pulse EAR” test.
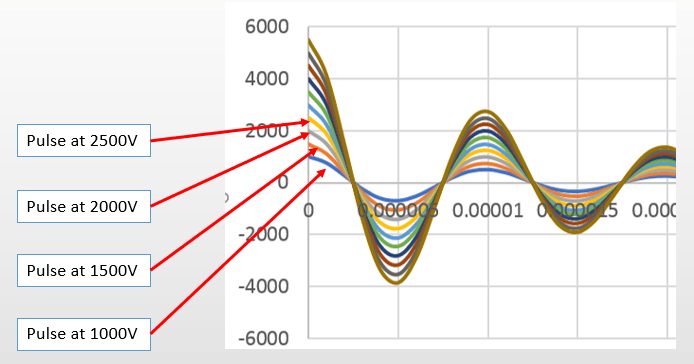
An EAR calculation will be done for the
The 1000V and 1500V waveforms
The 1500V and 2000V waveforms
The 2000V and 2500V waveforms
Etc.
Each of these EAR values is then plotted on a graph as shown below.
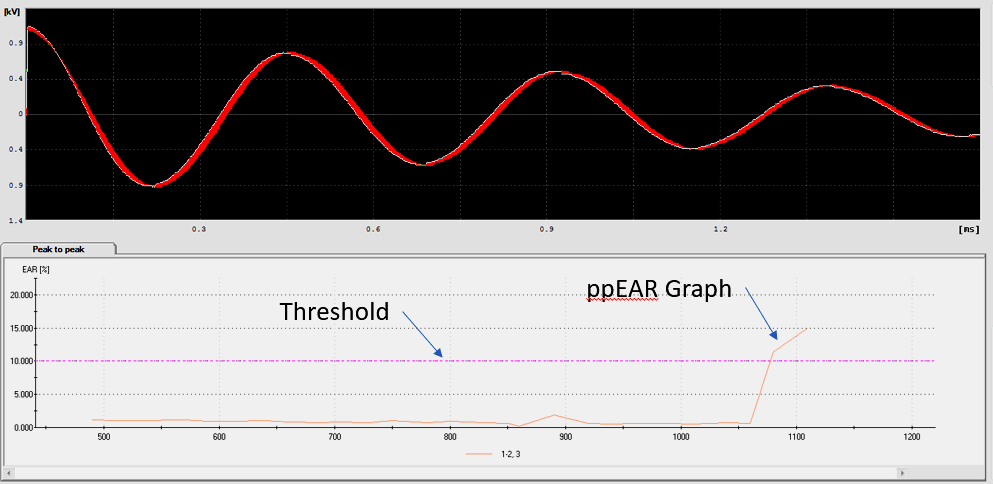
As discussed above, the shift can be rather slight – such small shifts might easily be missed by just watching the waveform progression by eye (as has been the tradition with manual surge testers).
Often the waveforms jump a very large amount as shown in the example below. Even a recovering alcoholic would be able to see the shift shown here.
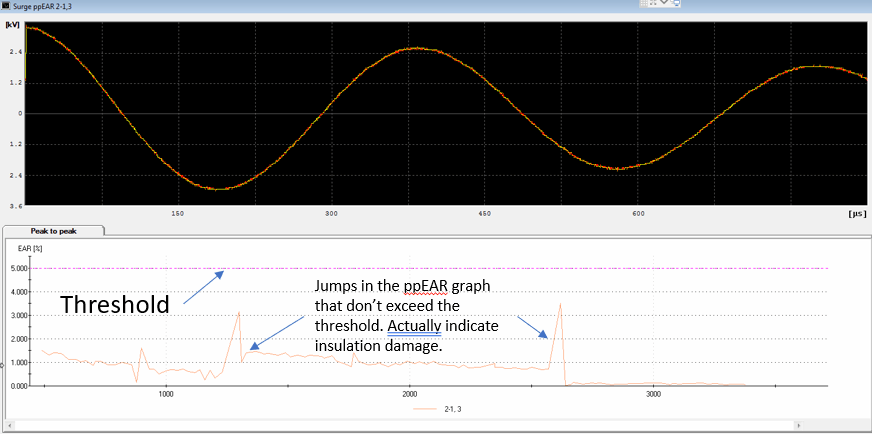
To make things even more interesting, the ppEAR plot might have small “shark teeth” in them that is also an indication of damaged insulation. The ppEAR graphs should be smooth because the test equipment is precisely controlling the increase in voltage in fixed steps. If the ppEAR graphs start showing spikes, the tester is telling us there is a problem in the insulation.
Surge With PD Testing
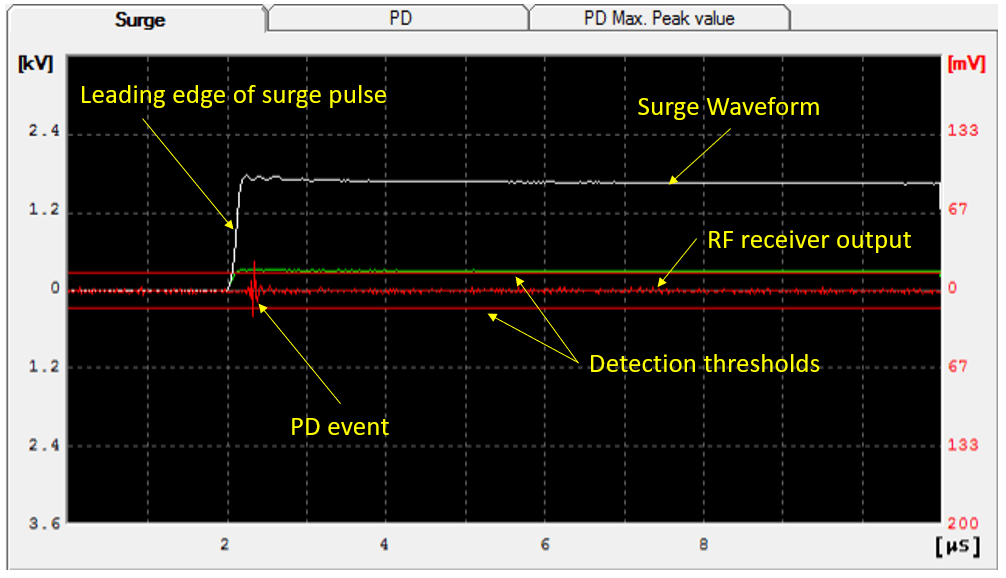
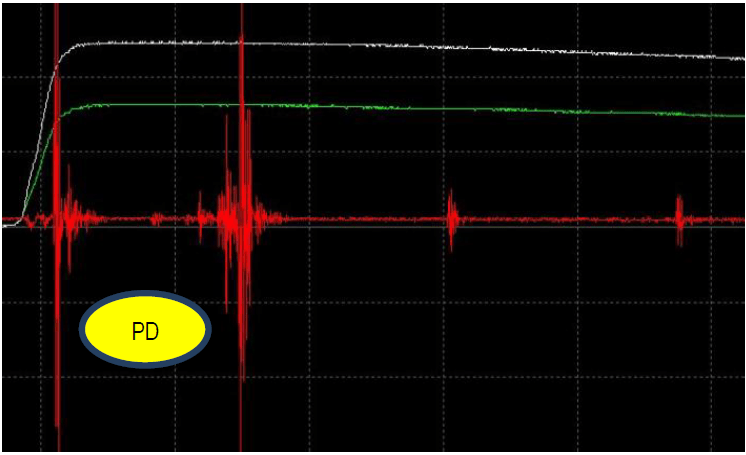
As described above, the surge test works by creating a voltage between loops of wire. If there is a void between the wires and the turn to turn voltage is high enough, then the gas within the void will break down. When this gas breaks down it emits radio waves from 10’s of kilohertz up to many gigahertz. This radio wave, often just called “RF” for radio frequency, is picked up by circuits within test equipment.
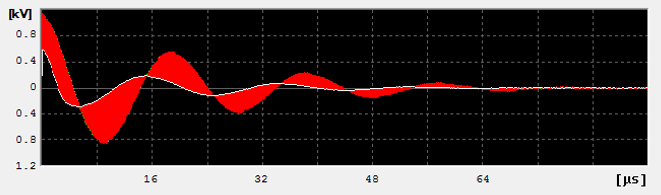
A screen capture that shows the PD on surge at work is shown below. The fuzzy red line at the zero-volt axis is the output of the PD receiver. The small transient seen just after the leading edge of the surge pulse is partial discharge. Note: these small voids in the insulation only emit a very small amount of energy so a very sensitive system is needed to observe the RF energy from the void breakdown.
Why Measure Partial Discharge?
Today (February 2021) about ½ or more of the AC induction motors produced today are used with a variable frequency drive (VFD). These VFD drives allow the motor to be controlled at a given speed or even at a given torque. All permanent magnet DC motors (PMDC motors) are operated with a VFD drive. (Also, most DC motors are also operated with a special type of drive that uses many of the same principles as a VFD drive for AC/PMDC motors.)
The way a VFD works is to synthesize a sine wave of a given frequency to operate a motor. For example, if an application needs to be run at about 1600 RPM, a 4 pole motor should be run with about a 53Hz sine wave. Typical applications for VFD driven motors are to operate conveyor belts or run fans and pumps.
Unfortunately, in the process of synthesizing the specific frequency sine wave, the drive creates voltage spikes that are applied to the motor thousands of times per second. So, even though the drive might synthesize a sine wave at a nominal 410V for example, there can be spikes in the voltage waveform on the order of 2-3times the line voltage, or 820-1230V.
It would be helpful to discuss why these overshoots exist. Most drives synthesize the sine wave by a method called pulse width modulation (PWM). Basically, an electronic switch connects the winding to DC voltage but only for short periods of time. If a higher voltage is needed, then the winding is left connected to the DC voltage longer. If less voltage is needed, the winding is connected for a shorter period. So, it can be said that the job of making a higher or lower voltage is done by just controlling the amount of time a switch is on or off – something easily done in the digital world.
An illustration of the PWM switching signal is shown below.
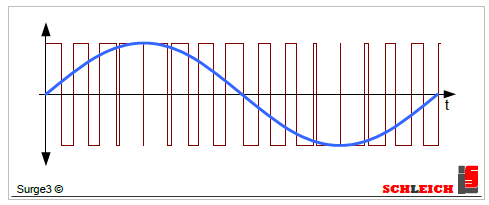
Keep in mind the number of times the switches are on or off is more like 100 times per cycle instead of the 10 or so shown in the illustration.
Now for the big problem: the switching of high currents to windings/inductors results in a situation where each on or off switching edge has a lot of overshoot, meaning there is a small voltage spike on every switching edge as shown the in illustration below:
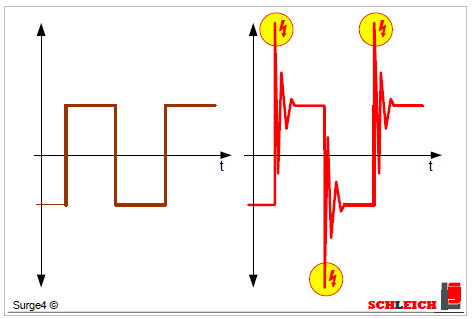
If these voltage overshoots are high enough to break down the small voids in the insulation (ground wall insulation or turn insulation), then the insulation around the void is rather quickly eaten up by the discharge. Without voids in insulation, there is very little possibility of there being any partial discharge in the widing. So it is worth taking a closer look at insulation voids.
Insulation Voids
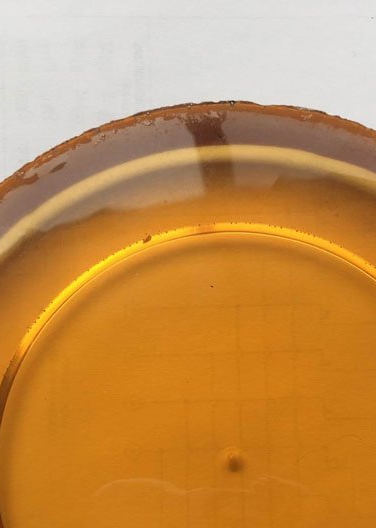
Voids are small bubbles or other shapes that do not have any insulation at all. A photo of voids in an epoxy resin are shown below.
Even though only round voids have been shown, these voids can take any shape. Often, there are voids between layers of tape in form wound coils or areas in a random wound winding where the resin just ran out of the area between strands of wire.
Rotor Coupling
An example of an unreliable comparison situation is where a rotor is installed in a three phase motor. Due to the unequal
number of slots in the rotor and stator, some phase windings will “see a different rotor”. Because of this difference, a
comparison of an assembled motor most likely will not be successful. There are exceptions, such as occasions where a
highly skewed rotor is in the motor. An example of rotor coupling is shown in the screen capture below. Here, all three waveforms are shifted from each other by a large amount.
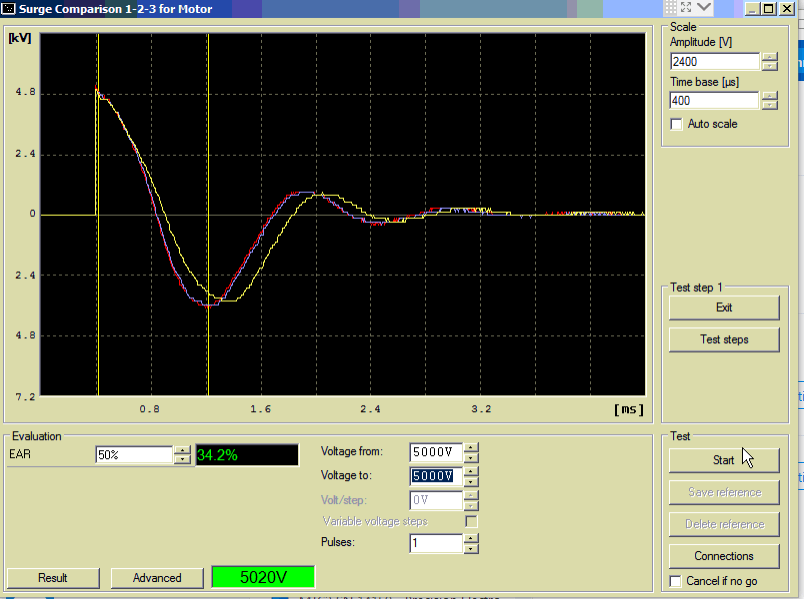
The three waveforms above are from the same stator from the previous screen capture, but the rotor shaft was rotated
120deg before the 2-3 test, and an additional 120deg for the 3-1 test.
Most likely, the yellow 3-1 test was ~10 degrees off of 120deg, so it’s waveform is a little shifted from the others.
The photo below illustrates the situation. Note the slot to slot distance in the stator compared the bar to bar spacing on the
rotor. They are not the same.
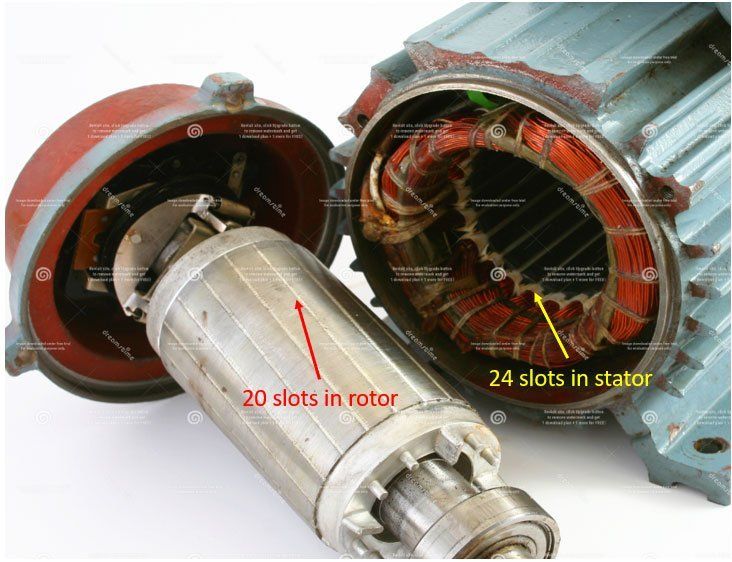
Some places around the air gap, the rotor bars will line up perfectly with the stator slots (which gives really good magnetic
coupling between the stator windings in that particular slot and the rotor bar) and somewhere else the rotor tooth will be
perfectly over the stator slot giving a completely different magnetic coupling. This difference in magnetic coupling is why
the waveforms for the three phases are different.
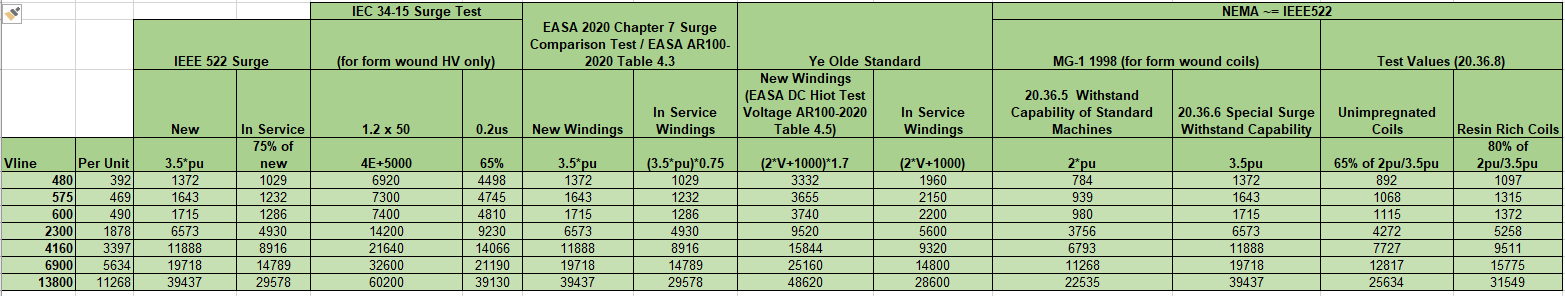
Industry Standards
Since surge testing has been around for almost a century, there several, well established test standards. Organizations like IEEE, IEC, NFPA, and EASA all have surge testing written into their standard documents. Surge testing is definitely an established, well recognized and well accepted method to test windings. The test standards prescribe the test voltages used for surge tests, the minimum rise time required, and the amount of change in the waveform shape. The chart below shows some of the test voltages used in surge testing.
Surge Voltage Distribution
As mentioned at the top of this article, a current pulse flowing into a winding gives rise to a turn to turn voltage. As shown
in the figure below, in a perfect world, the turn to turn voltage will be equal between adjacent loops of wire in the coil. Often
times, the term used to describe the voltages within the coil is “the voltage distribution”.
In reality, the turn-turn voltage is not equal for every turn in the winding and is in fact rather nonlinear. This nonlinearity is
due to several reasons:
1. The materials in an inductor, specifically the iron core, are not linear. The physical behavior of materials is itself
nonlinear which gives rise to some of the nonlinearities in the turn to turn voltage distribution.
2. The rise time of the current pulse is very fast which leads to a situation where the time it takes some time for the
current wavefront to move through the coil. This means one coil might have the current pulse passing through it
while its neighboring coil still has no idea the current pulse is even there. In other words, we must think of the
conductors in the coil as transmission lines and the length of the current wavefront is less than the length of the
conductors that form the loops of wire in the coil.
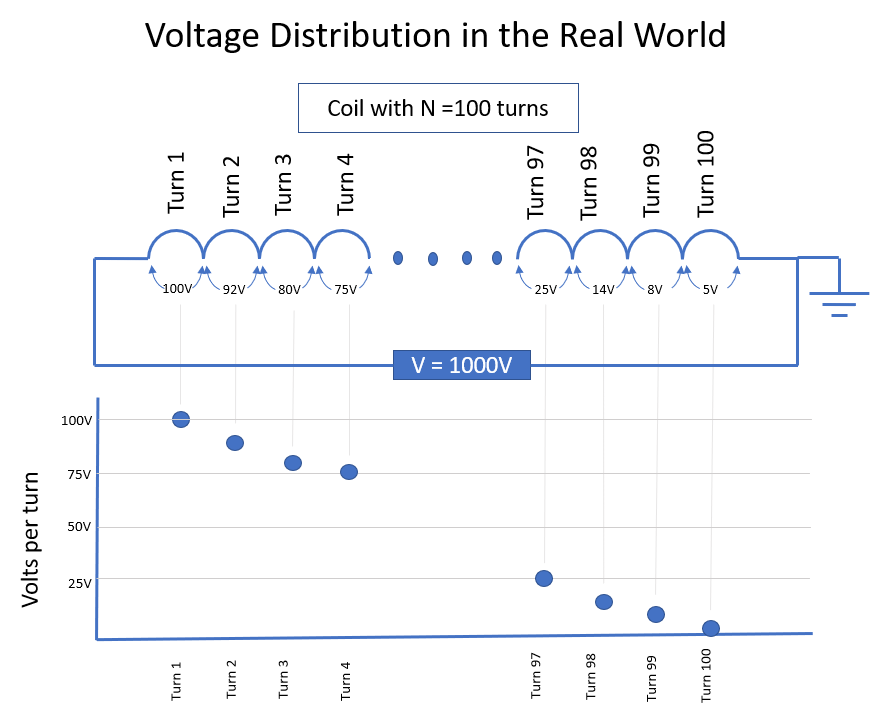
The illustration below shows an example of the 1000V pulse being applied to a 100 turn coil. Instead of having 10V per turn
between loops, there is a number of different voltages with the first turn seeing more voltage than the other turns.
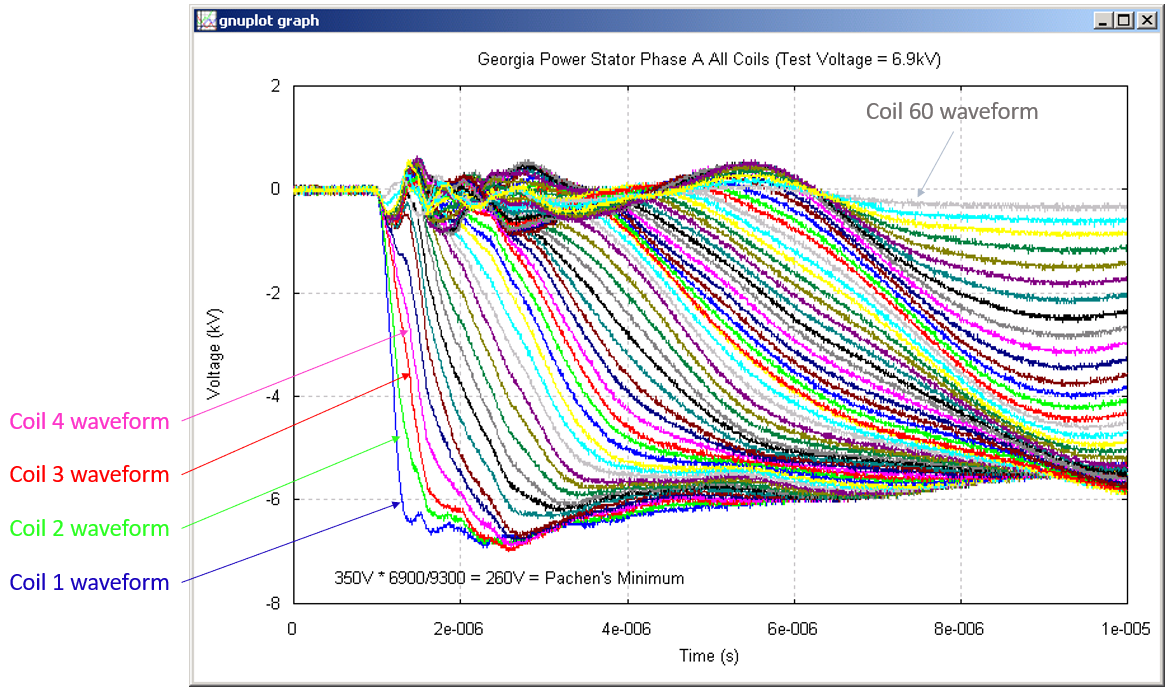
Instead of just looking at illustrations, let’s look at real measurements. The figure below shows the measured voltages at every single turn of a coil during a surge test of a 60 turn winding in a 6.9kV three phase induction motor. The waveform of every single turn was measured and recorded.
The vertical distance between the waveforms is the turn to turn voltage. Remember, voltage is really the “potential
difference” between two physical points in space. The figure below shows what is meant by the potential difference.
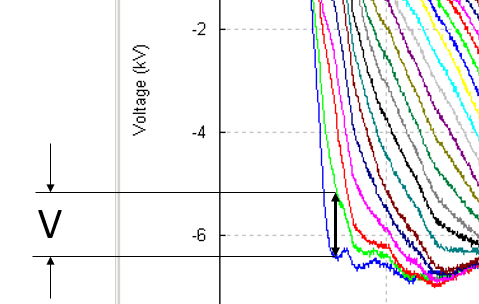
Subtracting the waveforms from each other shows the turn to turn voltage vs time as the pulse propagates through the
winding. This process of subtracting waveforms from each other is shown graphically in the illustration below.
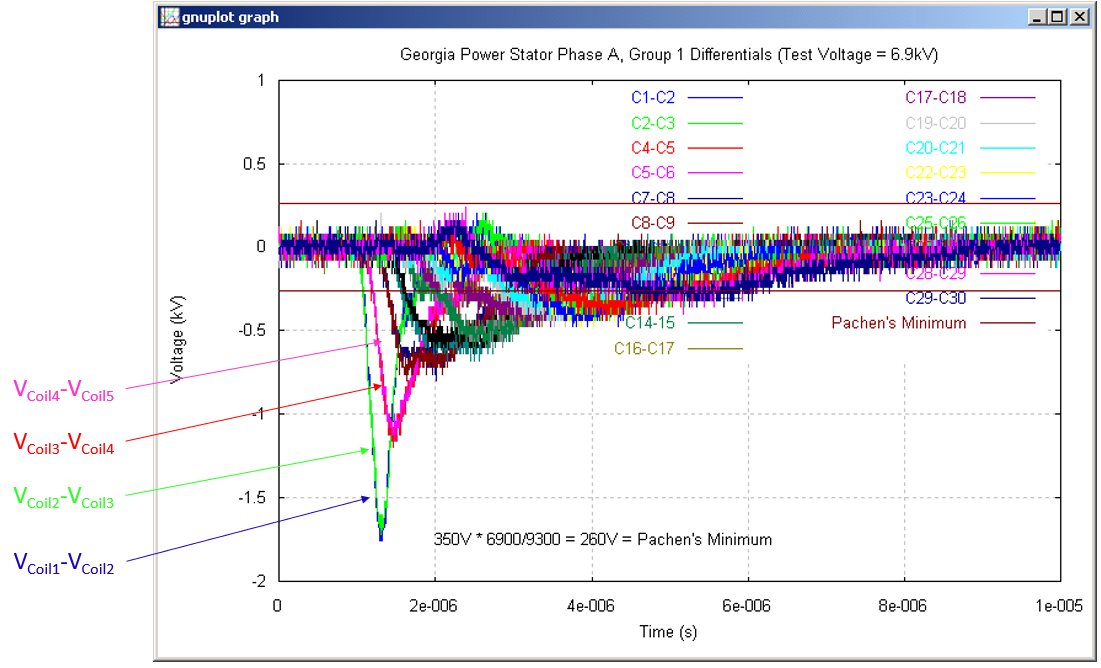
More than just the turn to turn voltage “potential difference” is shown in the graph above. The first thing to note is the turn-turn
voltage is higher across the first few coils of the winding as compared to the other coils in the winding. This is because each individual loop of wire in the winding is filtering the high speed components of the current pulse and by doing so, there is a the first turn is "holding off” voltage that subsequent turns never see. The second thing that jumps right out is time it
takes for the pulse to move through the coils.
In these measurements shown here, the winding is from a 6.9kV 8000HP stator. This stator is made with form wound coils with three turns in each coil. A photo of the coil is shown below and shows the insulation removed from the end of each of the coils – these are the points at which the waveforms / voltages were measured.
NAICS Codes
334515,
54138, 811219,811310
Cage Code
4P2J9
Duns Number
79-119-1351

Contact Info:
MOTOR DIAGNOSTIC SYSTEMS, INC.
inside.sales@mdsusa.net
Sales: +1 (970) 461-1348
or +1(877) 461-1348
Fax: +1 (866) 223-0800
Business Hours
- Mon - Fri
- -
- Sat - Sun
- Closed